
A football scoreboard tells you who won, but it doesn’t always explain how the game unfolded. A team might win by two touchdowns despite struggling to move the ball, while another could dominate possession and still lose because of a few costly mistakes.
Looking beyond the final score gives you a clearer picture of team performance. By understanding which statistics matter and how they relate to specific situations, you can recognize strengths and weaknesses that aren’t immediately obvious during a game.
Why the final score doesn’t tell the whole story
A 28-14 victory might suggest that one team controlled the game from beginning to end. However, the numbers can reveal something different. Perhaps the winning team scored twice after recovering fumbles deep in its opponent’s territory.
Those touchdowns still count, but they don’t necessarily indicate that the offense consistently moved the ball well.
The same applies to close losses. A team that loses 24-21 might have gained more yards, converted more third downs, and controlled possession for most of the afternoon. One missed field goal or poorly timed interception may have changed the result.
That’s why evaluating individual plays alongside broader statistics provides a more accurate understanding of performance. The final score matters, but it shouldn’t be the only measurement you consider.
How to interpret offensive statistics correctly
Total offensive yards are among the most frequently discussed football statistics. Although they provide a useful starting point, they can also create a misleading impression.
Imagine one team gains 420 yards but scores only 17 points. Another produces 310 yards and finishes with 27 points. The difference might come from red-zone efficiency, turnovers, or starting field position.
Rather than focusing exclusively on total yardage, consider how effectively each offense uses its opportunities.
For readers comparing different interpretations of offensive performance, reviewing statistical discussions alongside resources such as Doc’s NFL handicapper betting tips can provide another perspective on how football matchups are evaluated.
Third-down conversion rates deserve particular attention. An offense that regularly converts third-and-4 can sustain drives and limit the opposing team’s opportunities. However, a team frequently facing third-and-12 has a more difficult task, even if its overall conversion percentage appears reasonable.
Yards per play can also reveal efficiency that total yardage misses. An offense averaging 6.2 yards per play may be more productive on individual snaps than one averaging 4.3, even when the second team accumulates more yards through additional possessions.
What defensive numbers reveal about team performance
A strong defense isn’t always the one recording the most sacks or interceptions. Sometimes, its biggest contribution is limiting an opponent’s ability to sustain drives and create scoring opportunities. To understand how well a defense performs, you need to look at more than the numbers in a traditional box score.
Take passing yards allowed, for example. Giving up 350 yards might suggest poor coverage, but the circumstances matter. If much of that yardage comes late in a game when the defense is protecting a comfortable lead, the total doesn’t necessarily reflect how effectively the unit played during the more competitive stages.
Third-down performance offers another useful perspective. A defense that regularly forces opponents to punt prevents drives from developing, even without producing spectacular plays. Holding a receiver to a short gain on third-and-long can be just as valuable as a sack because both outcomes can end the possession.
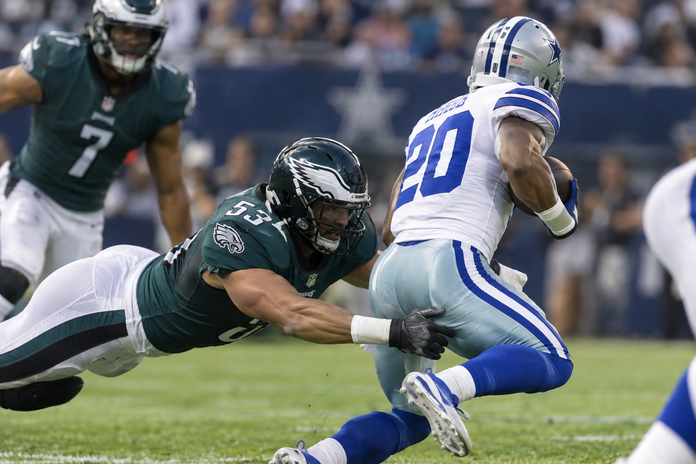
Tackling efficiency also deserves attention. Missed tackles can turn routine plays into significant gains, particularly when defenders fail to stop receivers after short completions. Teams that tackle consistently force offenses to earn their yardage rather than allowing them to advance through avoidable mistakes.
Defensive statistics become more meaningful when you consider the opponent’s playing style. A team facing a run-heavy offense will encounter different challenges than one defending against frequent passing attempts. Understanding those differences helps you evaluate defensive performance more fairly instead of relying on isolated statistics.
Why possession time can be misleading
Time of possession measures how long each team controls the football, but having the ball longer doesn’t automatically mean playing better.
A team with an effective running game might control possession for 35 minutes by sustaining lengthy drives. That approach can reduce the number of opportunities available to the opponent.
However, an offense built around explosive passing plays may score quickly without needing extended possession.
Consider a team that scores three touchdowns on drives lasting less than two minutes each. Its possession time might be relatively low, but its offensive efficiency could still be excellent.
The more useful question is what each team accomplishes with its possessions.
You can gain additional insight by examining points per drive, average starting field position, and the percentage of possessions that reach scoring range. These measurements help explain why two teams with similar possession times may produce very different results.
How turnovers influence the numbers
Turnovers have a significant impact on football games, particularly when they occur near either end zone.
A quarterback might complete 25 of 32 passes and gain 290 yards, producing impressive passing statistics. If two of those completions are offset by interceptions that give opponents excellent field position, the overall performance becomes less impressive.
Turnover location matters, too.
Losing possession near midfield is different from fumbling at your own 10-yard line. The second mistake creates an immediate scoring opportunity for the opposing offense.
It’s also worth distinguishing between forced turnovers and careless mistakes. A defender making an exceptional interception reflects strong defensive execution, while an unpressured quarterback throwing directly to an opponent may indicate poor offensive decision-making.
Looking at the circumstances surrounding turnovers helps you understand their actual influence rather than simply counting them.
Why recent statistics need proper context
Season averages can hide meaningful changes in team performance. Injuries, coaching adjustments, and difficult schedules can all influence results over several weeks.
For example, a team averaging 120 rushing yards per game might appear dependable on the ground. But if its starting offensive linemen have recently suffered injuries, that season average may no longer represent its current capabilities.
Opponent quality also matters. Producing 30 points against a struggling defense doesn’t necessarily indicate the same level of performance as scoring 24 against one of the league’s strongest units.
When reviewing recent games, consider both the numbers and the circumstances that produced them.
Three or four games can reveal developing trends, but that’s rarely enough evidence to draw firm conclusions about a team’s long-term ability.
Final thoughts
Football statistics become more useful when you understand the situations behind them. A large yardage total, impressive passing percentage, or lengthy possession doesn’t automatically translate into effective performance.
The next time you review a game, focus on how efficiently each team used its opportunities rather than relying on the scoreboard alone. That approach will help you recognize the decisions and performances that genuinely shaped the result.