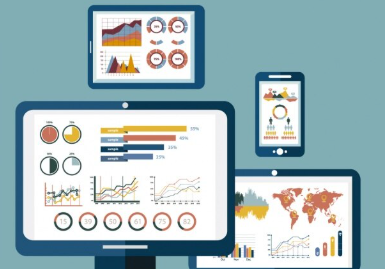

Money moves fast, and markets shift overnight. A stock jumps, a currency drops, and a trend starts in seconds. If you blink, you miss it. Old ways of tracking investments were not reliable. But now we have a lot of data. However, data alone is not enough. You need to see and understand it fast. That is where interactive data tools come in. They turn numbers into pictures and help you make better decisions. Here is how they improve your investing.
Real-Time Monitoring and Speed
Speed matters in investing. A delay of minutes can lead to costly losses. But worry not. Interactive tools show you what is happening now. Charts update in real time. You see price moves as they happen. You see volume spike and how patterns form. So you can react before the moment passes.
Some interactive data visualisation tools are built for real-time monitoring and speed. For example, iO charts are designed for live data. They stream information directly to your screen without any lag or delay. You see the market’s truth as it unfolds.
Many well-known marketing firms, like NP Digital, also use interactive data visualisation tools. They help them track data in real time to adjust spending. If something is not working, they shift fast.
Enhanced Data Analytics
Raw data is just rows of numbers, which are hard to read and understand. Interactive tools turn those rows into visualisations, such as graphs, heat maps, and trend lines. It helps you see the pattern and opportunity. Your brain processes images faster than text. This way, you spot things you would miss in a spreadsheet.
When using interactive data visualisation tools, you can drill down, click a point, and see its details. You can also zoom in on a time frame and compare one asset to another. This changes how you analyse. You are not just reading reports. You are exploring, asking questions, and getting answers in real time.
Scenario Testing and Risk Management
The best investors do not guess. They test. Interactive tools let you run scenarios. What if the market drops 10%? What if interest rates rise? What if a competitor launches a new product? You can model these situations and see how your portfolio would react. This helps you find the weak spots and fix them before they break.
With the help of interactive data visualisation tools, risk management becomes visual. You see where your money is exposed, and which bets are safe. This helps you make informed decisions. This is not about predicting the future. It is about being ready for whatever comes. You know your risks, and you have a plan.
Better Communication
Investing is often a team work. You have partners, clients, and advisors. You need to explain your thinking to others. A spreadsheet full of numbers may confuse people. But a chart shows the same data in a way that they understand. They can see the trend, understand the risk, and trust your judgment. This builds confidence. Clients feel involved, and partners feel informed. Moreover, decisions get made faster because everyone is on the same page.